 Karti Tripathi
779820f6a5
Karti Tripathi
779820f6a5
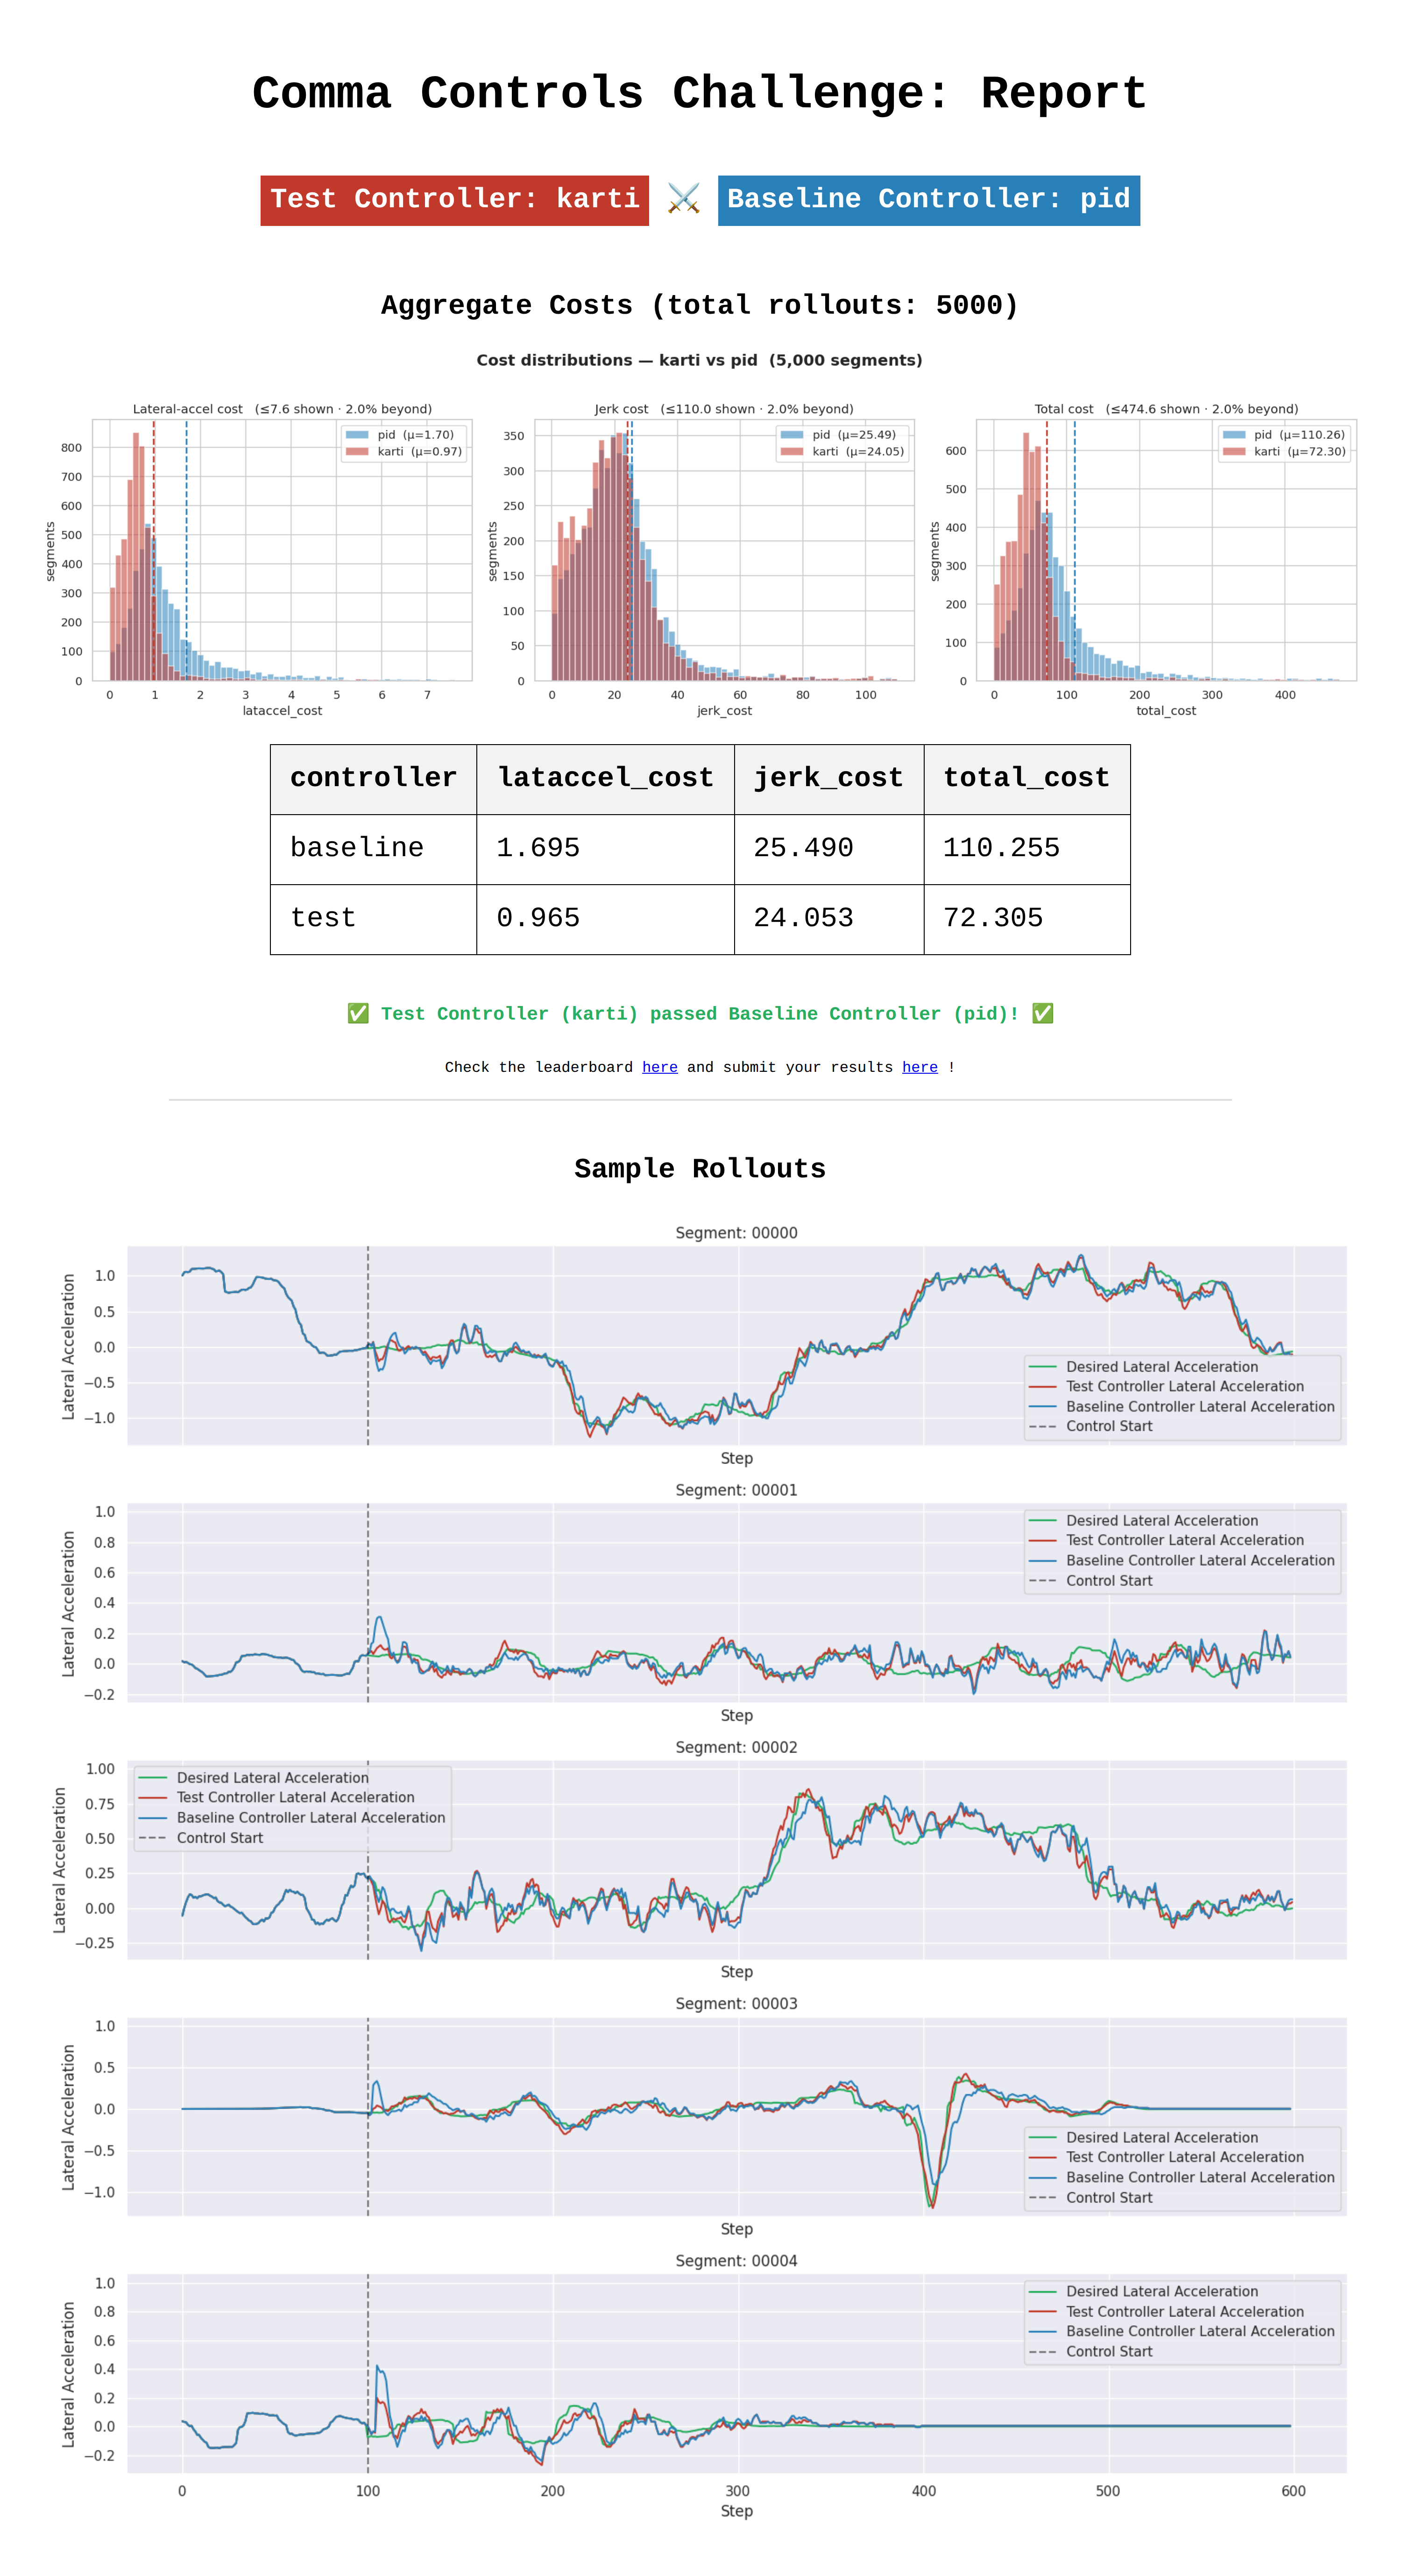
eval.py bins costs 0-1000 (width 10); lataccel is ~0-5 so all 5k segments
collapse into one bar. Re-binned per metric, zoomed to the 98th pct, with
karti-vs-pid overlay and mean lines.
1.6 MiB
3000x5518px
1.6 MiB
3000x5518px